Scalping With MA And MACD
The combined method of moving
average (MA) and MACD indicators is often practiced by scalpers and daily
traders. Time frames for entry can be 1 hour (1-hour) or lower (30 minutes or
15 minutes), while the time frame for the trend direction is usually 1-hour,
4-hour (4-hour) or daily. This method is often used because MACD can run well
at all time frame trading.
Determining Trend Directions
For the scalper, the time frame of 1
hour and 4 hours is often used to determine the direction of the current trend
before determining the entry position at a lower time frame. The popular and
frequently used trend indicator is the Average Directional Index (ADX), but
because at low time frames the response of this indicator tends to be slow
(lagging), the scalper often uses the moving average.
To increase the sensitivity of
moving averages that are also lagging, an exponential moving average (EMA) type
is calculated by weighting at the final price. In practice, EMA is accurate
enough to show the direction of the current trend.
In the following GBP / USD 4-hour
example, the period EMA 55 is used as a trend detector tool. Rules:
• When the price moves above the
EMA-55 indicator curve, the price is considered uptrend move and the trader
will only look for a buy opportunity.
• Conversely, when the price is
under the EMA-55 curve, it is considered downtrend and the trader will only
look for sell opportunities.
Determining the Momentum Entry
After knowing the position of the
desired entry, traders can determine the entry (timing) by looking at the MACD
indicator and OSMA histogram. Entry does not have to be on 4-hour time frame,
but can be at lower time frame according to trader's habit.
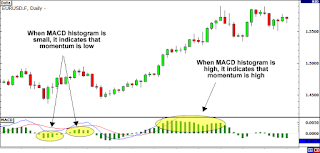
Buy if the MACD curve has crossed
the signal line from the bottom up and at the same time the OSMA histogram is
moving above the 0.00 level. Under these circumstances, uptrend momentum is
strong, and the wider the distance between the MACD curve and the signal line
the stronger the trend.
Exit when the MACD curve has cut the
signal line from top to bottom and at the same time the OSMA histogram is
moving below the 0.00 level. Under these conditions, uptrend momentum is
weakening and possibly the price will reverse direction.
For entry sell apply otherwise. Sell
when MACD cuts the signal line from top to bottom and OSMA moves below the 0.00
level. Then, exit if MACD cuts the signal line from bottom to top and OSMA
above level 0.00.
With this method the stop level can be determined rather tightly, and no matter how much risk / reward ratio is planned, the trader must exit when the trend's momentum has started to weaken.


No comments:
Post a Comment